Loggie's Monitoring and Alarming
Loggie's monitor eventbus is designed in a publish and subscribe mode. Each component sends metrics to a specified topic, which is consumed and processed by an independent listener.
For example, file source collects some indicators from the collected logs and send them to filesource topic. After aggregated and calculated by filesource listener, these indicators will be printed and exposed as Prometheus indicators.
There is a loose coupling relationship between components, topics and listeners. For example, file source will regularly send the full matching indicators to filewatcher topic, filewatcher listener process and expose the indicators.
Monitor Configuration
The monitor eventbus is configured in the global system configuration, the example is as follows:
Config
loggie:
  monitor:
    logger:
      period: 30s
      enabled: true
    listeners:
      filesource: ~
      filewatcher: ~
      reload: ~
      queue: ~
      sink: ~
  http:
    enabled: true
    port: 9196
logger controlls the log printing of all metrics indicators. Metrics generated by the configured listeners will be aggregated and printed in Loggie log at fixed intervals (set by period), which is convenient for backtracking and troubleshooting.
listeners is used to configure whether the related listener is enabled.
Prometheus metrics are exposed at /metrics on http.port by default. You can curl <podIp>:9196/metrics to view the current metrics.
Core Indicators of Log Collection
Currently there are the following listeners:
- filesource: The indicator data about current log collection, such as which files are currently being collected, and what is the collection status?
- filewatcher: Timed full traversal (default 5min) to check all files matching the path, monitor the global collection status, and determine whether there are files that have not been collected in time, etc.
- reload: Number of reloads
- queue: Queue status
- sink: Metrics of sending, such as the number of successes or failures, etc.
Deploy Prometheus and Grafana
You can use the existing Prometheus or Grafana. If you need a new deployment, please refer to https://github.com/prometheus-community/helm-charts/tree/main/charts/kube-prometheus-stack.
Deploy with Helm:
helm repo add prometheus-community https://prometheus-community.github.io/helm-charts
helm repo update
helm install prometheus prometheus-community/kube-prometheus-stack -nprometheus --create-namespace
Note
Due to some reasons, some of these k8s.gcr.io images may not be available for download. You can consider downloading the chart package to replace it and then redeploy it.
After confirming that the Pod is running normally, you can access grafana. The way to access grafana through a proxy can be referred to:
kubectl -nprometheus port-forward --address 0.0.0.0 service/prometheus-grafana 8181:80
Grafana username and password can be viewed in prometheus-grafana sercret. Use base64 -d.
Added Loggie Prometheus Monitoring
In the Kubernetes cluster where Loggie is deployed, create the following ServiceMonitor to allow Prometheus to collect Loggie Agent metrics.
apiVersion: monitoring.coreos.com/v1
kind: ServiceMonitor
metadata:
  labels:
    app: loggie
    release: prometheus
  name: loggie-agent
  namespace: prometheus
spec:
  namespaceSelector:
    matchNames:
    - loggie
  endpoints:
  - port: monitor
  selector:
    matchLabels:
      app: loggie
      instance: loggie
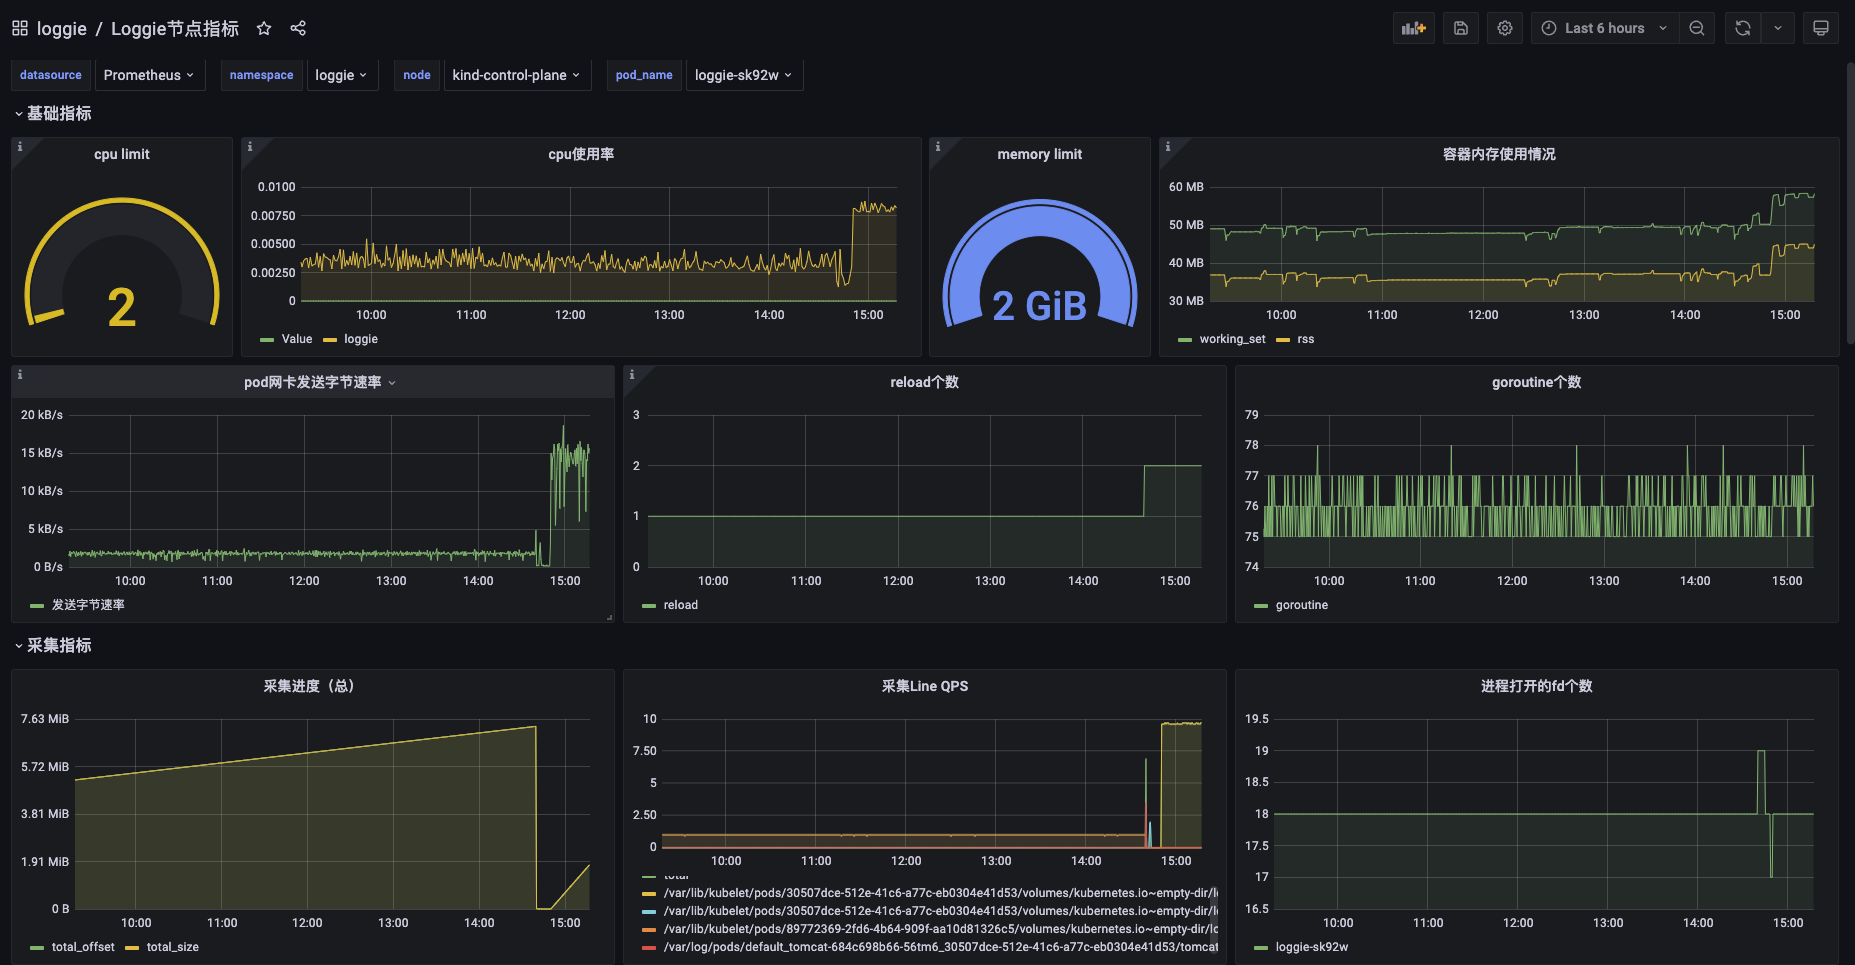
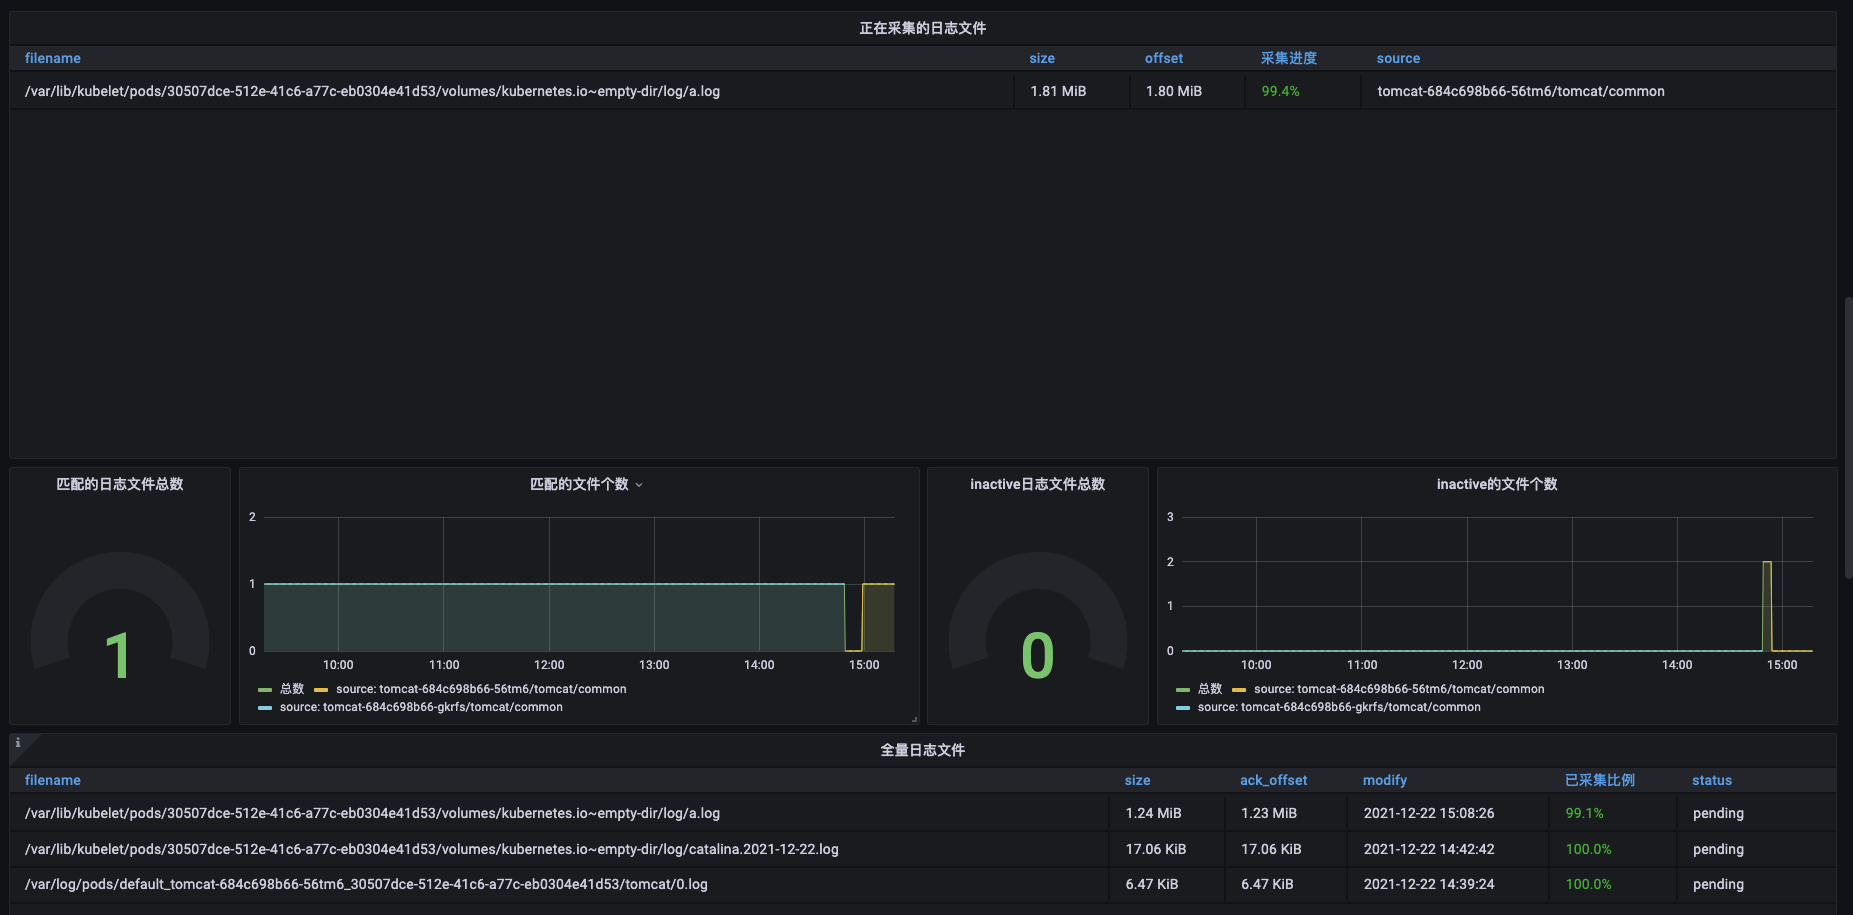
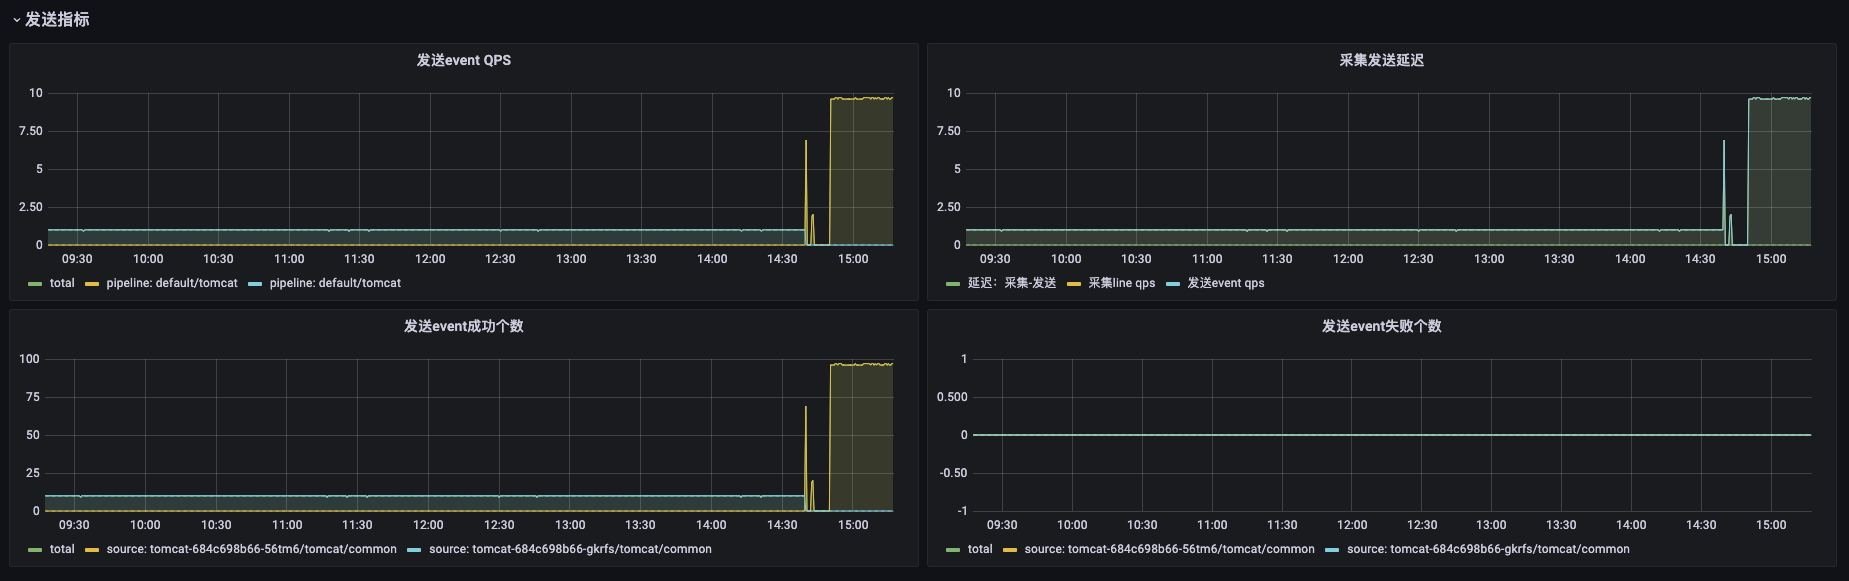
At the same time, we need to add the json in the install project to Grafana to display Loggie's monitoring console.
Note
The Kubernetes version and the Grafana version may be different, which may lead to incompatible chart display. Modify as you need.
The imported Grafana chart is as shown following: