Use Loggie to Collect Container Logs
Before reading this article, it is recommended to refer to Log collection in Kubernetes.
How does Loggie Collect Container Logs?
Due to the good extensibility of Kubernetes, users can define their own CRDs to express their desired states, and develop Controllers with the help of some frameworks.
Based on this idea, what kind of logs a service needs to collect and what kind of log configuration is required are the expectations of users. This requires us to develop a log collection Controller to achieve.
Therefore, the user only needs to describe the logs of which Pods need to be collected and log path in pod in the CRD LogConfig.
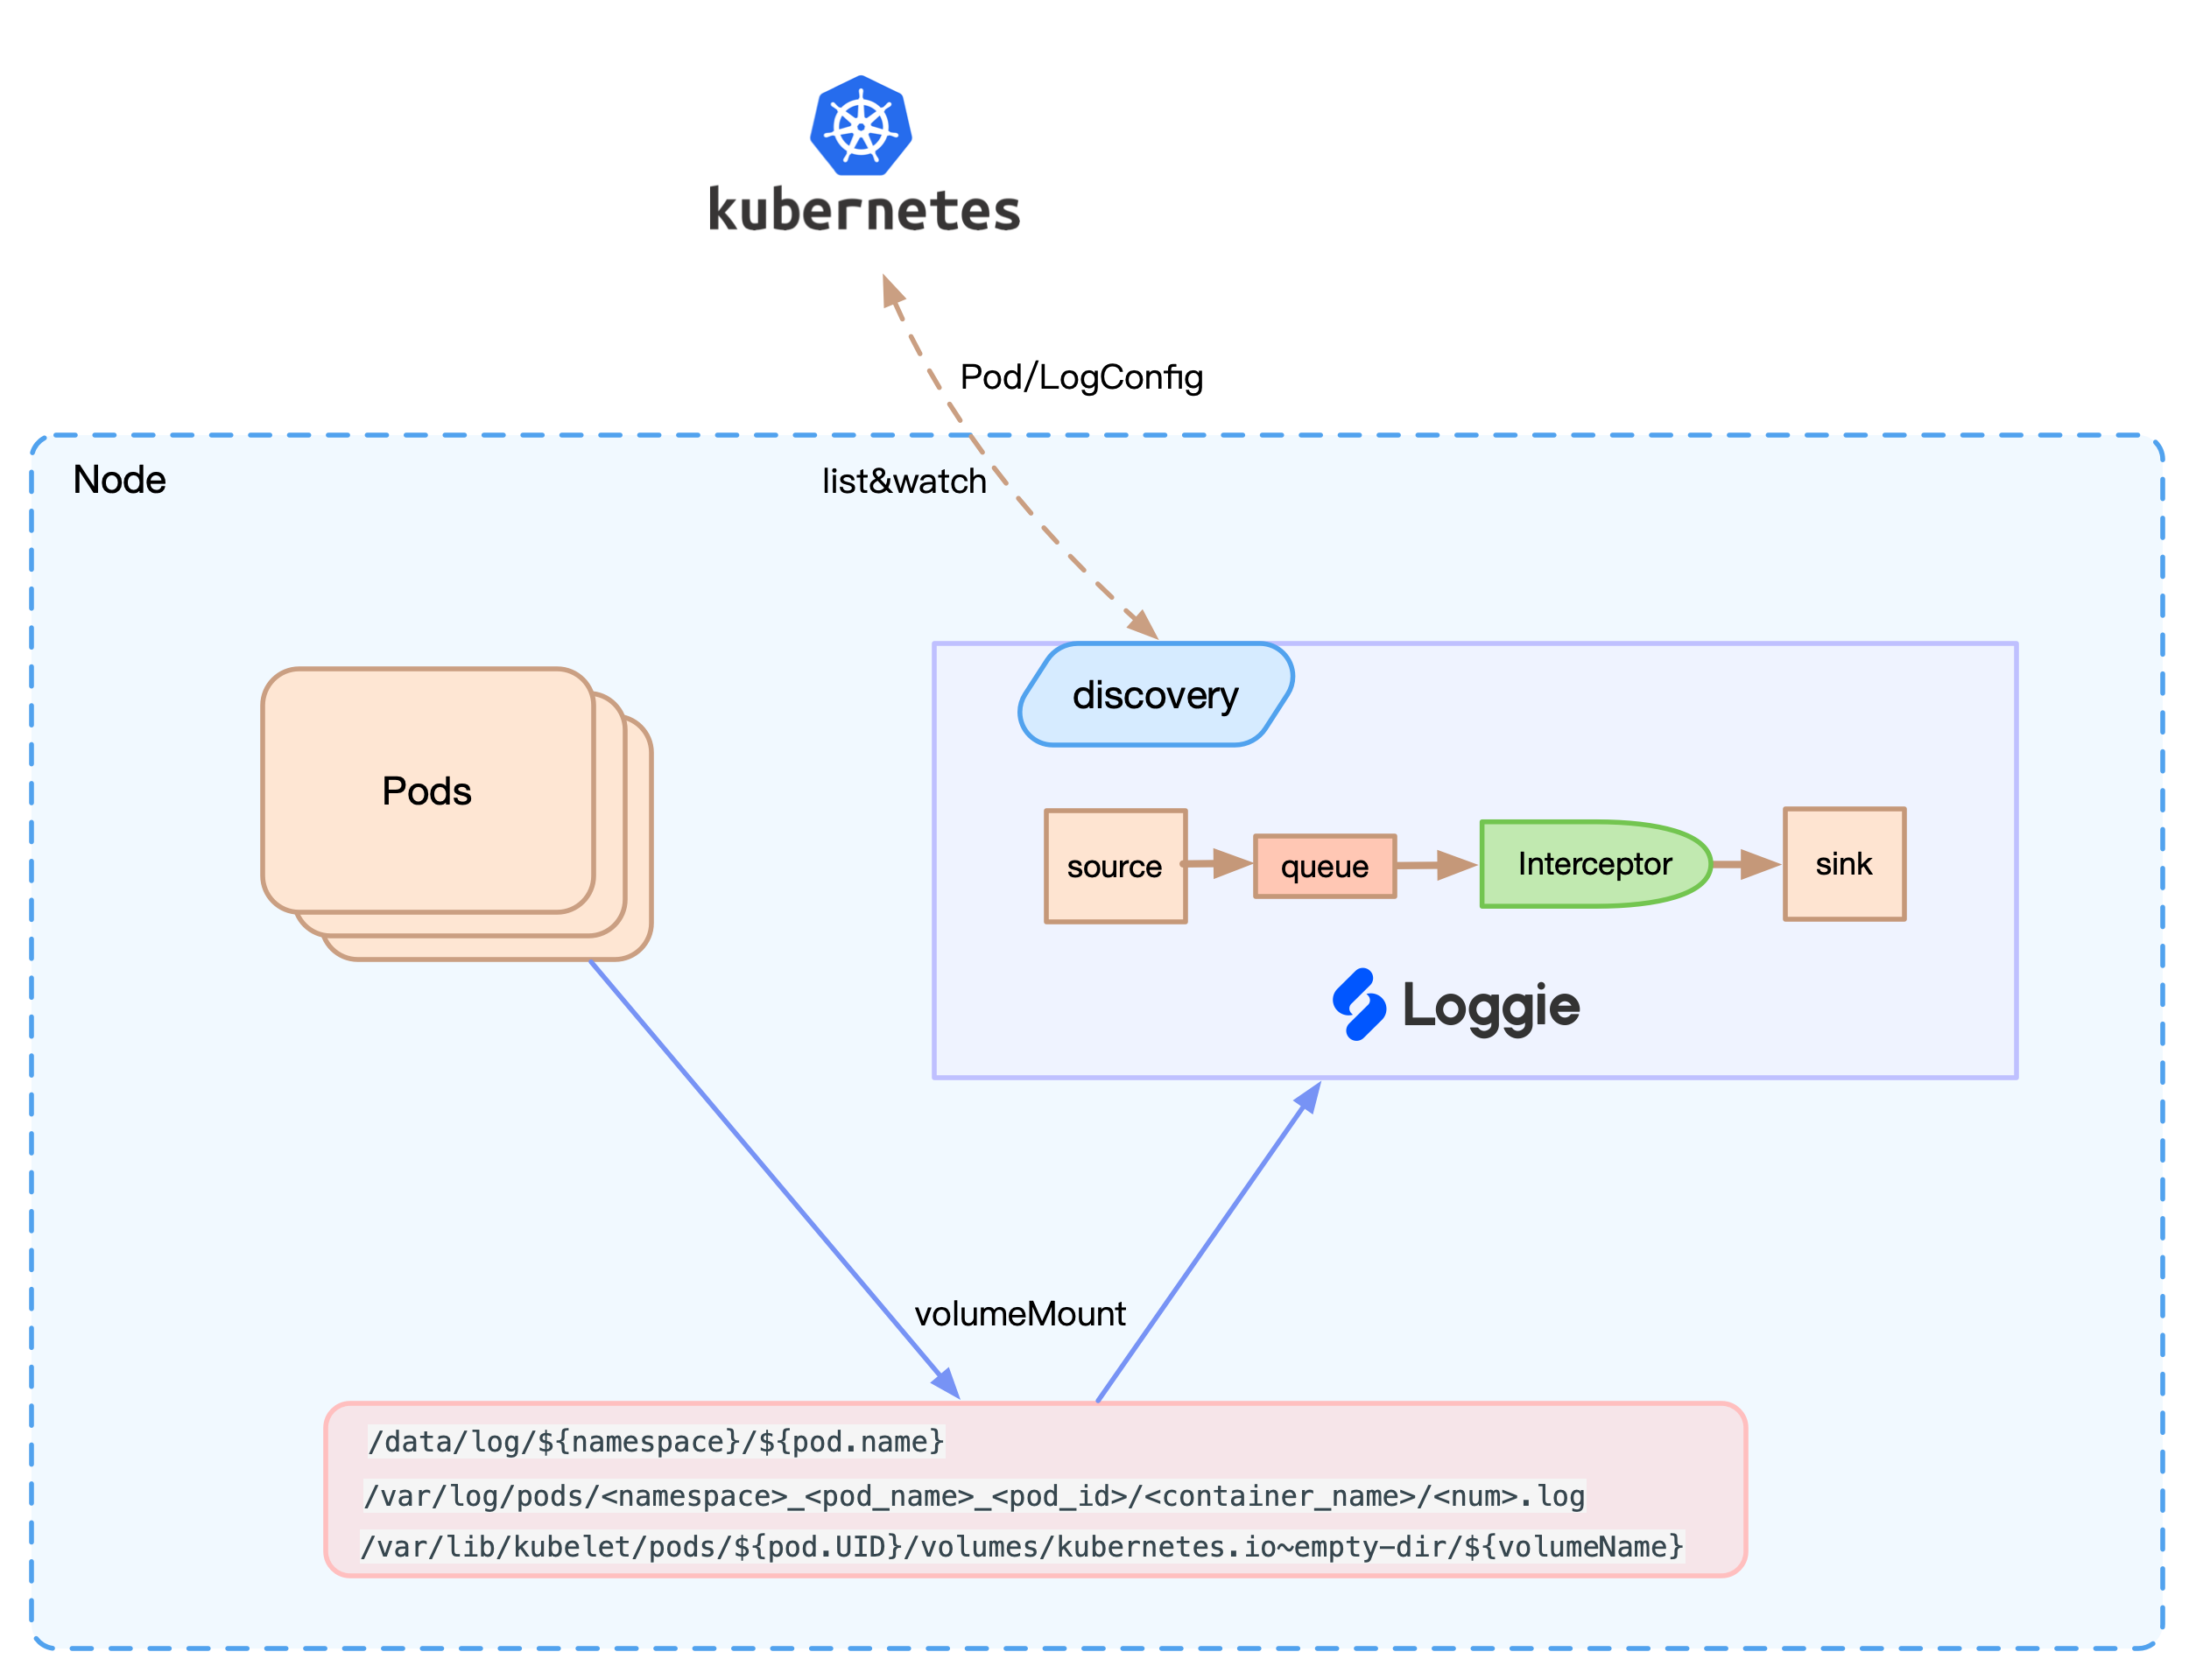
The core architecture is shown in the following figure:

Loggie will perceive Pod and CRD events and dynamically update the configuration. At the same time, Loggie can find the corresponding file on the node for collection according to the Volume mounted on the log file path. In addition, according to the configuration, the Env/Annotation/Label on the Pod can be automatically added to the log as meta information.
At the same time, compared with the way of mounting all nodes to the same path for collection, it also solves the problem of not being able to fine-tune the configuration for a single service and collecting irrelevant logs.
Benefits are not limited to these. Loggie can perform corresponding adaptation and support based on Kubernetes in terms of dynamic configuration delivery and monitoring indicators.
CRD Instructions
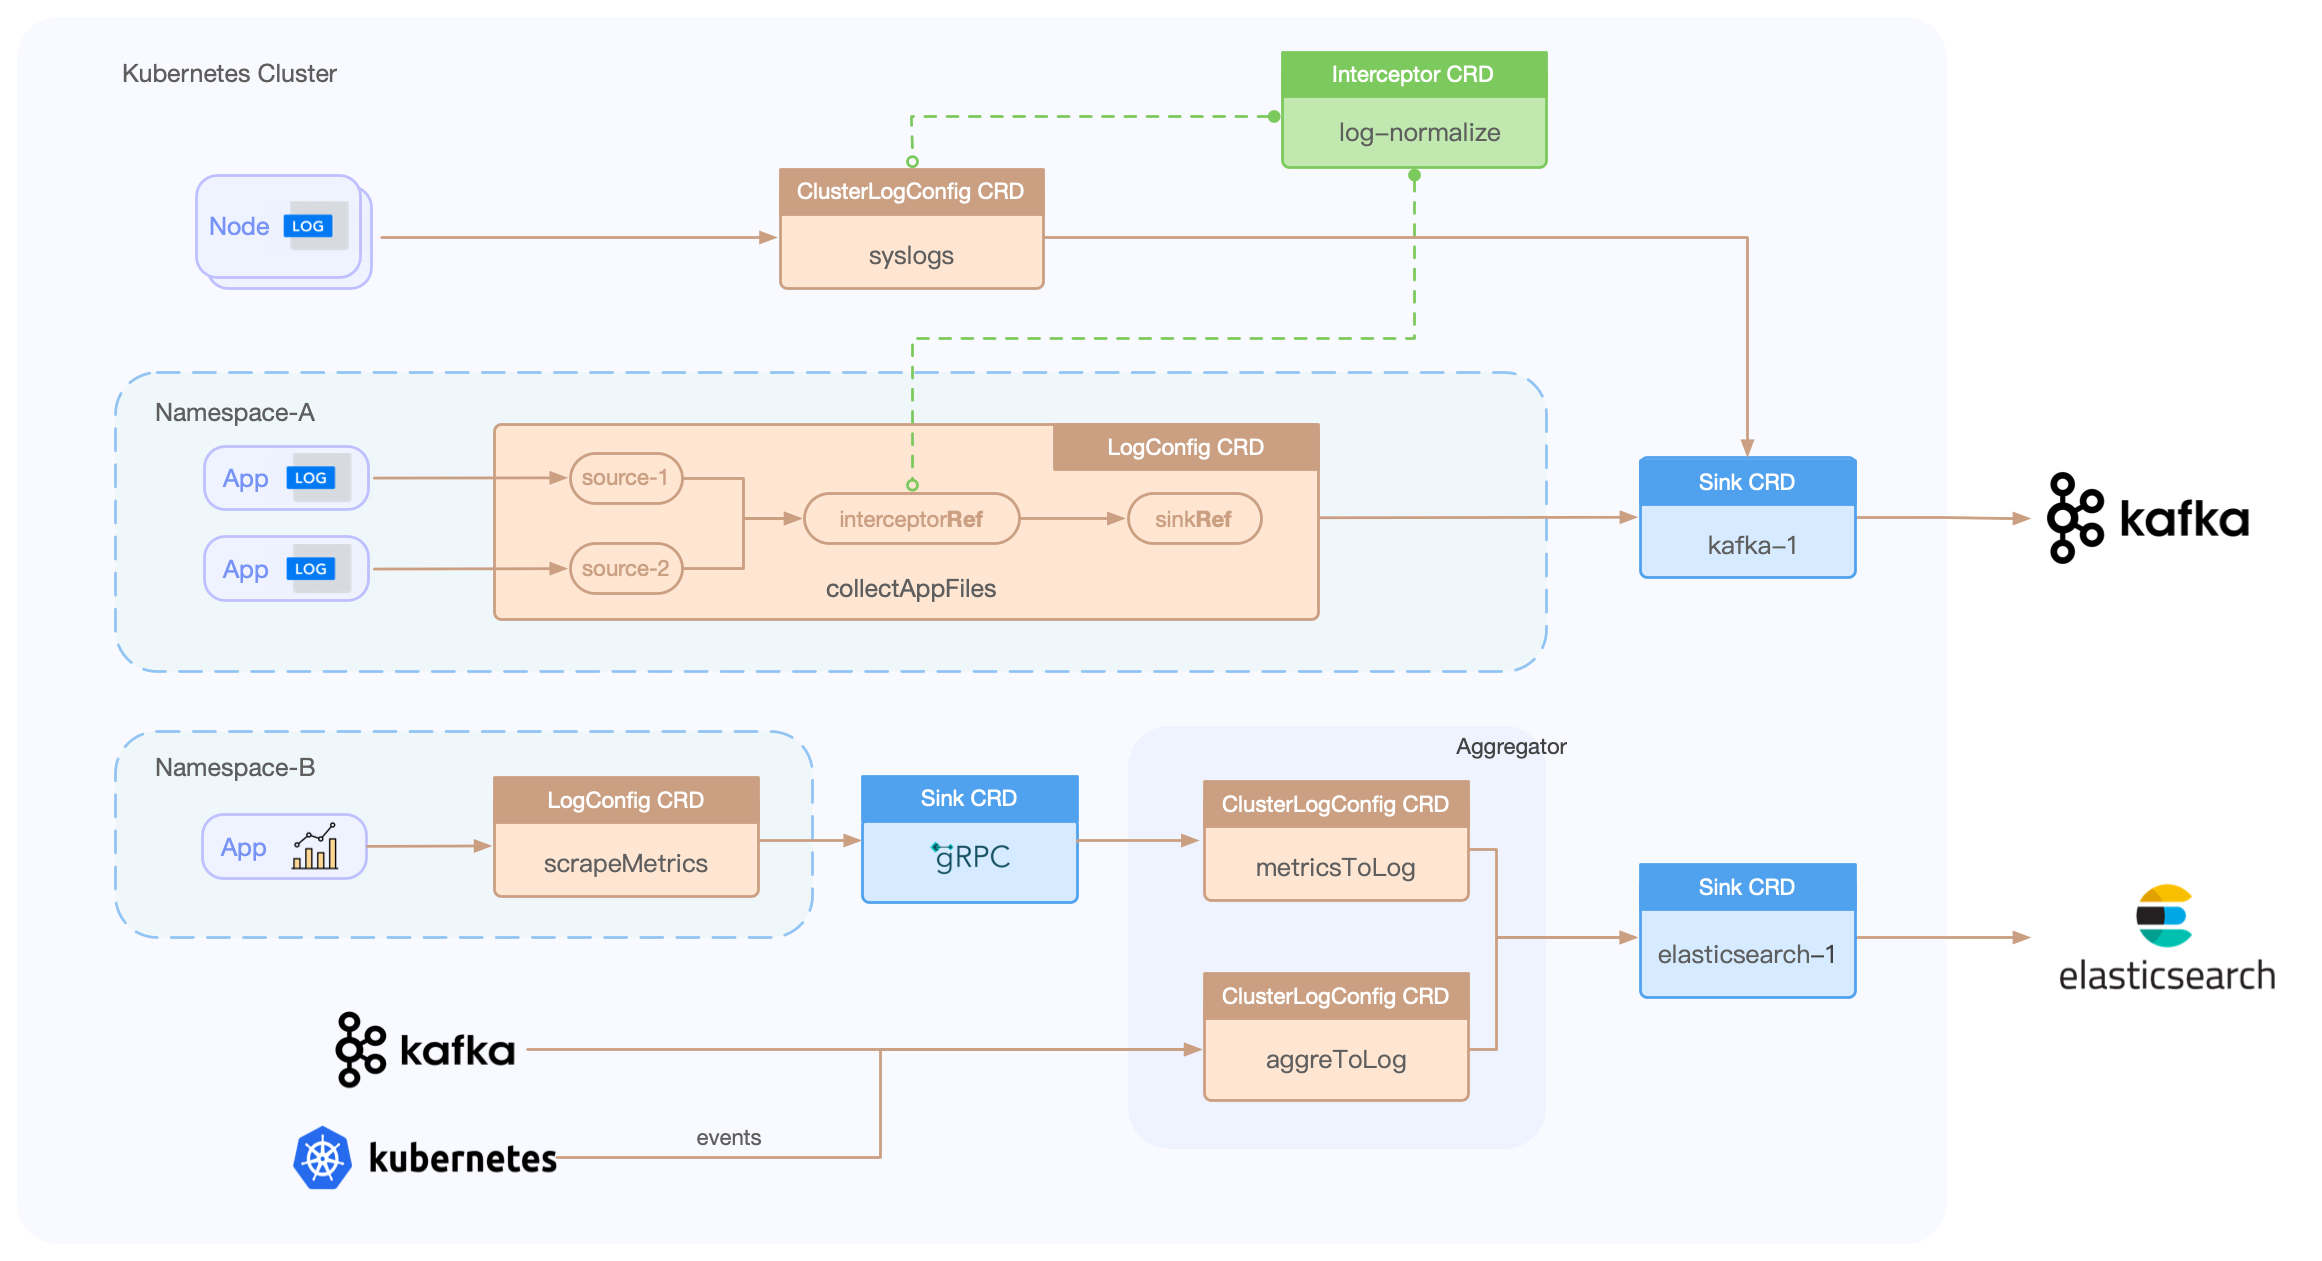
Loggie currently has the following CRDs:
- LogConfig: namespace-level CRD, used to collect Pod container logs, which mainly includes the source configuration of the collection, as well as the associated sink and interceptor.
- ClusterLogConfig: cluster-level CRD, which indicates the cluster-level collection of Pod container logs, the collection of logs on nodes, and the distribution of general pipeline configuration for a Loggie cluster.
- Sink: a sink backend that needs to be associated in ClusterLogConfig/LogConfig.
- Interceptor: an interceptors group that needs to be associated in ClusterLogConfig/LogConfig.
The process using CRD is as follows:

Preparation
Architecture
What is the overall architecture?
- The Loggie Agent sends data directly to the backend such as Elasticsearch or other storage, etc.
- The Loggie Agent sends data to the Loggie Aggregator for transit processing, and then to other back-end storage
- The Loggie Agent sends data to Kafka, and oggie Aggregator consumes Kafka and sends data to the backend
...
This article only focuses on the acquisition side. If you need to deploy the Loggie Aggregator, please refer to Loggie Aggregator.
Before collecting container logs, make sure that the Loggie DaemonSet has been deployed in Kubernetes. Deploy Loggie in Kubernetes
Info
We recommend using the DaemonSet method to collect container logs, Loggie plan to supports the automatic injection of Loggie Sidecar to collect logs in the future. RoadMap
Usage
How do business pods mount logs?
It is recommended that if you are not sensitive to the possibility of log loss, such as operation and maintenance logs, you can use emptyDir. If the logs are important and cannot be lost, use hostPath and configure subPathExpr on volumeMount to realize path isolation.
Example
apiVersion: apps/v1
kind: Deployment
metadata:
  labels:
    app: tomcat
  name: tomcat
  namespace: default
spec:
  replicas: 1
  selector:
    matchLabels:
      app: tomcat
  template:
    metadata:
      labels:
        app: tomcat
    spec:
      containers:
      - name: tomcat
        image: tomcat
        volumeMounts:
        - mountPath: /usr/local/tomcat/logs
          name: log
      volumes:
      - emptyDir: {}
        name: log
apiVersion: apps/v1
kind: Deployment
metadata:
  labels:
    app: tomcat
  name: tomcat
  namespace: default
spec:
  replicas: 1
  selector:
    matchLabels:
      app: tomcat
  template:
    metadata:
      labels:
        app: tomcat
    spec:
      containers:
      - env:
        - name: POD_NAME
          valueFrom:
            fieldRef:
              apiVersion: v1
              fieldPath: metadata.name
        - name: NAMESPACE
          valueFrom:
            fieldRef:
              apiVersion: v1
              fieldPath: metadata.namespace
        image: tomcat
        name: tomcat
        volumeMounts:
        - mountPath: /log
          name: datalog
          subPathExpr: $(NAMESPACE)/$(POD_NAME)
      volumes:
      - hostPath:
          path: /data/log
          type: ""
        name: datalog
Caution
Make sure that the log path mounted by the Pod is not shared by multiple Pods. For example, two Pods under a Deployment use the hostPath without subPathExpr to mount the log directory. If the two Pods are scheduled on the same node, they will be printed to the same log directory and file, which may cause collection exceptions.
We first create the tomcat Deployment of the above example for log collection.
kubectl apply -f tomcat-emptydir.yml
Next, we will collect the tomcat logs and send them to Elasticsearch. If you want to collect other container logs or send them to other backends, you only need to modify the configuration.
Deploy Elasticsearch and Kibana (optional)
Since this demo sends data to Elasticsearch, here we deploy Elasticsearch and Kibana.
If you already have Elasticsearch and Kibana in your environment, this step can be ignored.
If you want to build a set of Elasticsearch and Kibana by yourself, here is the suggestion:
If there is no helm installed, you need to download helm。
Use the following command:
helm repo add elastic https://helm.elastic.co
helm install elasticsearch elastic/elasticsearch --set replicas=1
helm install kibana elastic/kibana
And:
kubectl port-forward service/kibana-kibana 5601:http
You can enter localhost:5601 in the browser to access the Kibana page.
Collect Container Logs
Create Sink
In order to indicate the Elasticsearch to which we are about to send logs, we need to configure the corresponding sink. There are two ways here:
-
If the entire cluster has only one storage backend, we can configure the defaults parameter in the global configuration file configMap. For details, please reference.
-
Use Sink CRD and refer to it in logConfig. This method can be extended to multiple backends. Different logConfigs can be configured to use different backend storage. In most cases, we recommend this method.
Create a sink as follows. Sink is a cluster-level CRD. It can be modified to other configurations in spec.sink.
Example
cat << EOF | kubectl apply -f -
apiVersion: loggie.io/v1beta1
kind: Sink
metadata:
  name: default
spec:
  sink: |
    type: elasticsearch
    index: "loggie"
    hosts: ["elasticsearch-master.default.svc:9200"]
EOF
kubectl get sink default to check if the creation is successful.
Create Interceptor (Optional)
Like Sink, there are two ways to configure interceptor:
-
In the global configuration file configMap, configure the defaults parameter. This means that all Loggie Agents use the default interceptors configuration.
-
Use the Interceptor CRD and be refered to in logConfig. This method will be more flexible and suitable for scenarios with certain requirements.
Loggie currently has three built-in interceptors metric (sending monitoring metrics)、 maxbytes (maximum event bytes limit)、 retry. Even if we do not use the above two ways to configure, the three default interceptors will still be used automatically.
Caution
- In the global defaults, configuring interceptors will overwrite the existing built-in interceptors. So if you use global defaults to configure interceptors, please add all the built-in interceptors, unless you are sure you don't need them.
- The logConfig configured using the interceptor CRD will not override the default and built-in interceptors, and will be added to the entire pipeline interceptors chain.
An example of creating an interceptor is as follows:
Example
cat << EOF | kubectl apply -f -
apiVersion: loggie.io/v1beta1
kind: Interceptor
metadata:
  name: default
spec:
  interceptors: |
    - type: rateLimit
      qps: 90000
EOF
Here we create an rateLimit interceptor, which can be used to limit the current of sending logs.
Use kubectl get interceptor default or kubectl get icp default to check whether the creation is successful.
Create logConfig
After creating the sink and interceptor, the most important thing is to create logConfig, indicating logs of which Pod we want to collect, and which logs of Pod to collect.
The spec.selector part of logConfig indicates the distribution scope of the log configuration. For collecting Pod logs, you need to configure type: pod and labelSelector to select the specified Pods. That is, collect the logs of these Pods.
An example is as follows:
spec:
  selector:
    type: pod
    labelSelector:
      app: tomcat
In addition, we need to configure the file source in pipeline.sources, that is, which logs of Pods to collect.
  pipeline:
    sources: |
      - type: file
        name: mylog
        paths:
          - stdout
          - /var/log/*.log
- Path
stdout, indicating the standard output path of the collection container. - The log file filled in path is the path in the container. (When the configuration is finally generated, Loggie will automatically update the path in pod to the path on the node, without the user's concern)
- Please use glob expression to fill in path.
- When
type: pod, pipeline.name will be automatically generated by loggie as${namespace}-${logConfigName}. - The final generated source.name will be
${podName}-${containerName}-${sourceName}.
Finally, we use sinkRef and interceptorRef to reference the sink and interceptor created above. A logConfig example as follows:
Example
cat << EOF | kubectl apply -f -
apiVersion: loggie.io/v1beta1
kind: LogConfig
metadata:
  name: tomcat
  namespace: default
spec:
  selector:
    type: pod
    labelSelector:
      app: tomcat
  pipeline:
    sources: |
      - type: file
        name: common
        paths:
          - stdout
          - /usr/local/tomcat/logs/*.log
    sinkRef: default
    interceptorRef: default
EOF
Use kubectl get logconfig tomcat or kubectl get lgc tomcat to check if the creation is successful.
At the same time, you can use kubectl describe lgc tomcat to check the status by viewing the events of logConfig.
If there are events similar to the following, the configuration has been delivered successfully.
Events:
  Type    Reason       Age   From                       Message
  ----    ------       ----  ----                       -------
  Normal  syncSuccess  55s   loggie/kind-control-plane  Sync type pod [tomcat-684c698b66-hvztn] success
We can also use kubectl -nloggie logs -f ${loggie-name} to check the log collection by viewing the logs of Loggie on specified node.
After the sending is successful, we can query the collected logs on Kibana.
Automatically Parse Container Stdout Raw Logs
Under normal circumstances, the standard output we collect is not the printed log content, but a entity encapsulated by the container runtime.
For example, the standard output of docker is in json form:
{"log":"I0610 08:29:07.698664 Waiting for caches to sync\n", "stream":"stderr", "time:"2021-06-10T08:29:07.698731204Z"}
The standard output of containerd looks like this:
2021-12-01T03:13:58.298476921Z stderr F INFO [main] Starting service [Catalina]
2021-12-01T03:13:58.298476921Z stderr F is the prefix content added at runtime, and remaining is the original log.
Especially if we configure multi-line log conllection, because the collected log content is inconsistent with the original output log, it will cause problems with matching multiple lines of the collected standard output log.
Therefore, Loggie provides a one-key switch configuration. In the system configuration, set the parseStdout to true.
parseStdout
config:
  loggie:
    discovery:
      enabled: true
      kubernetes:
        parseStdout: true
Loggie will automatically add source codec to parse the original business log when rendering LogConfig.
Note:
-
It is only valid when the path is only
stdout:
[valid][invalid]sources: | - type: file name: common paths: - stdoutThe above needs to be changed to two sources: [valid]sources: | - type: file name: common paths: - stdout - /usr/local/tomcat/logs/*.logsources: | - type: file name: stdout paths: - stdout - type: file name: tomcat paths: - /usr/local/tomcat/logs/*.log -
Currently only the original log content will be retained into
body, and the rest will be discarded. - Automatic parsing of stdout is actually achieved by automatically adding source codec when LogConfig is rendered into Pipeline configuration.
Container Log Collection Without Mounting Volumes
Although we recommend using mounted volume (emptyDir/hostPath+subPathExpr) to hang out log files for collection by Loggie, there are still many cases where we cannot uniformly mount log path of Pods of the business. For example, some basic components cannot configure independent log volumes, or the business is simply unwilling to change the deployment configuration.
Loggie provides the ability to collect container logs without mounting, and can automatically identify and collect log files in the container root filesystem.
You only need to set the configuration in values.yml in helm chartrootFsCollectionEnabled to true, and fill in the container runtime (docker/containerd) of the actual environment, as follows:
rootFsCollectionEnabled
config:
  loggie:
    discovery:
      enabled: true
      kubernetes:
        containerRuntime: containerd
        rootFsCollectionEnabled: false
After the modification is complete, helm upgrade again.
The helm template will automatically add some additional mount paths and configurations. If you upgrade from a lower version, you need to modify the deployed Daemonset yaml. Please refer to issues #208 for specific principles.